BPF
BPF是什么?
微型、安全的“小程序虚拟机”,被直接内嵌到了内核这个“总部”里面。你可以用一种特殊的、简化版的语言编写一些小程序,然后把这些小程序发送到内核里去运行。
BPF相比于perf和ftrace有什么区别?
- 可编程: bpf是可编程的, 可以执行用户编写的基于事件的程序
- 在内核上下文中处理: 其他的工具需要内核把事件信息转储到用户空间进行处理, 但是BPF可以在内核空间中,进行过滤, 保存, 检索,计算延迟等操作, 可以在生产环境部署
BPF原理是什么?
1. BPF程序或者指令
用户编写BPF指令程序, 可能是c语言的
2. BPF 讲程序加载到内核
BPF验证器
BPF验证器负责检查你的程序是否符合要求
- 是否会无线循环?
- 是否会访问无效内存?
- 是否会引发崩溃??
BPF即时编译器JIT (just in time complier)
jit负责把你的代码—编译⇒机器指令
3. 附着事件
bpf程序, 必须附着到内核的事件上去. 当这个事件产生的时候, BPF程序就会被内核调用执行
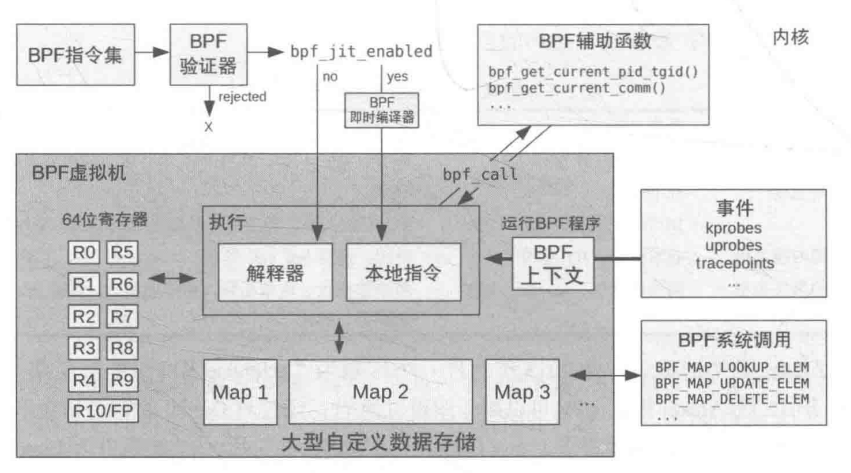
BPF框架的代码在哪里
实现代码
代码是在kernel\bpf\中, 其中包含了BPF虚拟机的实现, 验证器, jit编译器, map的代码
hooks代码
内核在一些关键路径上, 预先埋下了这些hook代码. 当代码执行到这里的时候, 就会检查是否有BPF小程序挂载在上面, 如果有, 就执行下.
可以把bpf程序, 挂载到静态观测点, 动态点上, 进行程序的观测和tracing
技术学习-性能之巅-静态观测点tracepoints 技术学习-性能之巅-动态点kprobes
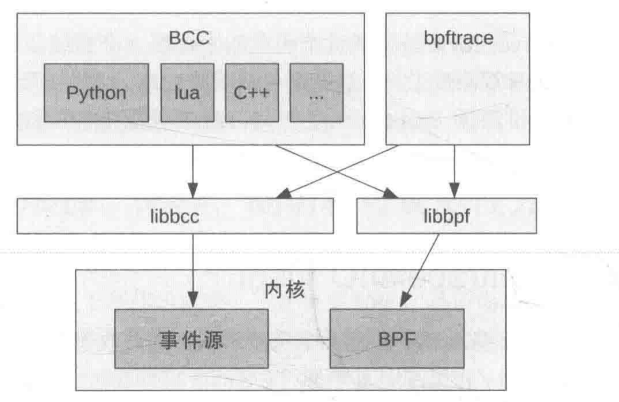
BPF前端是指什么?
BPF主要区分两种前端: BCC和bpftrace
BCC和bpftrace
区别
- BCC适合于复杂的工具, 而bpftrace适合定制程序
- BCC经常作为更上层图形化仪表监控的数据源, 而bpftrace经常是有问题的时候, 才开发特定的工具去解决问题
- BCC编程相对复杂, 需要懂python, lua c 平均程序长度220多行
- bpftrace编程相对简单, 使用bpftrace自有的语法, 平均长度只有20多行
怎么理解这两者之间的关系?
- 简单来说, 这两个都是排查性能问题的工具: 但是BCC类似于你写的那种C语言程序, 语法复杂,自由度更高 bpftrace类似于shell语法, 简短的命令就可以实现一些功能
- 如果需要一个长期监控的固化生产监控的话, 也推荐使用
BCC, 消耗更低(因为bpftrace还是需要jit,消耗性能)- 另外, 这两个可以结合使用, 比如用
BCC的现成的脚本去监控问题出现在哪个模块, 然后编写针对性的bpftrace脚本去定位问题
共同点
- 两个都基于内核的BPF框架和perf_event采样
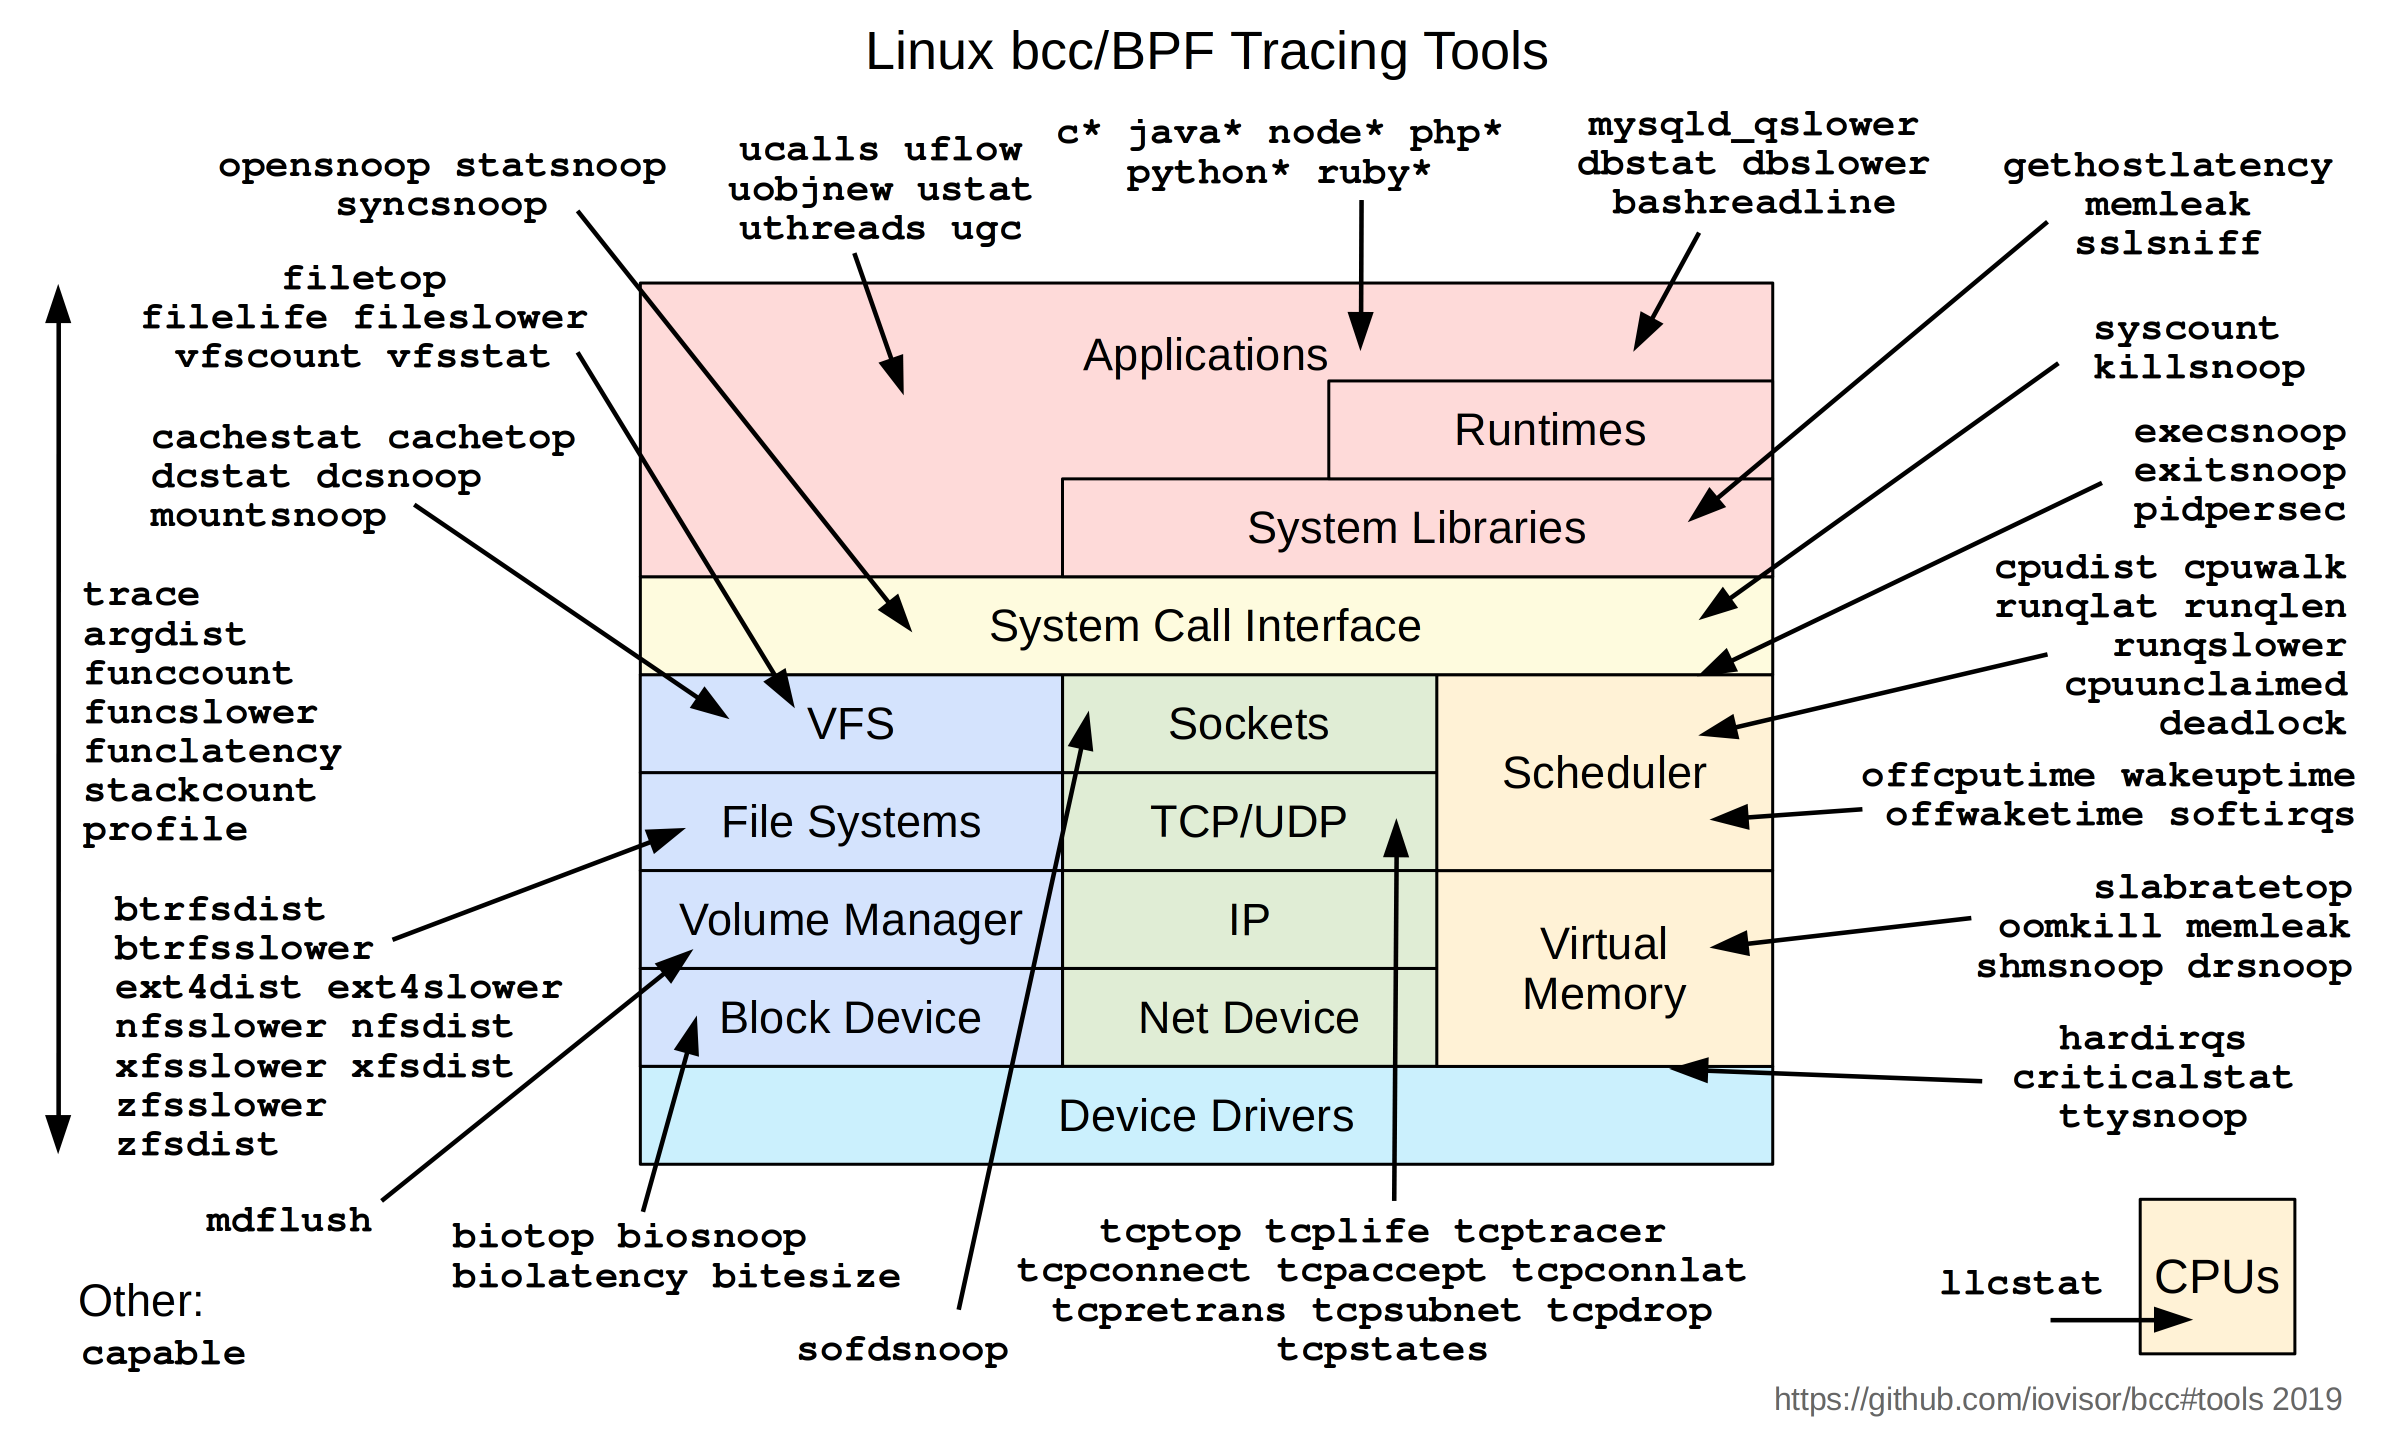
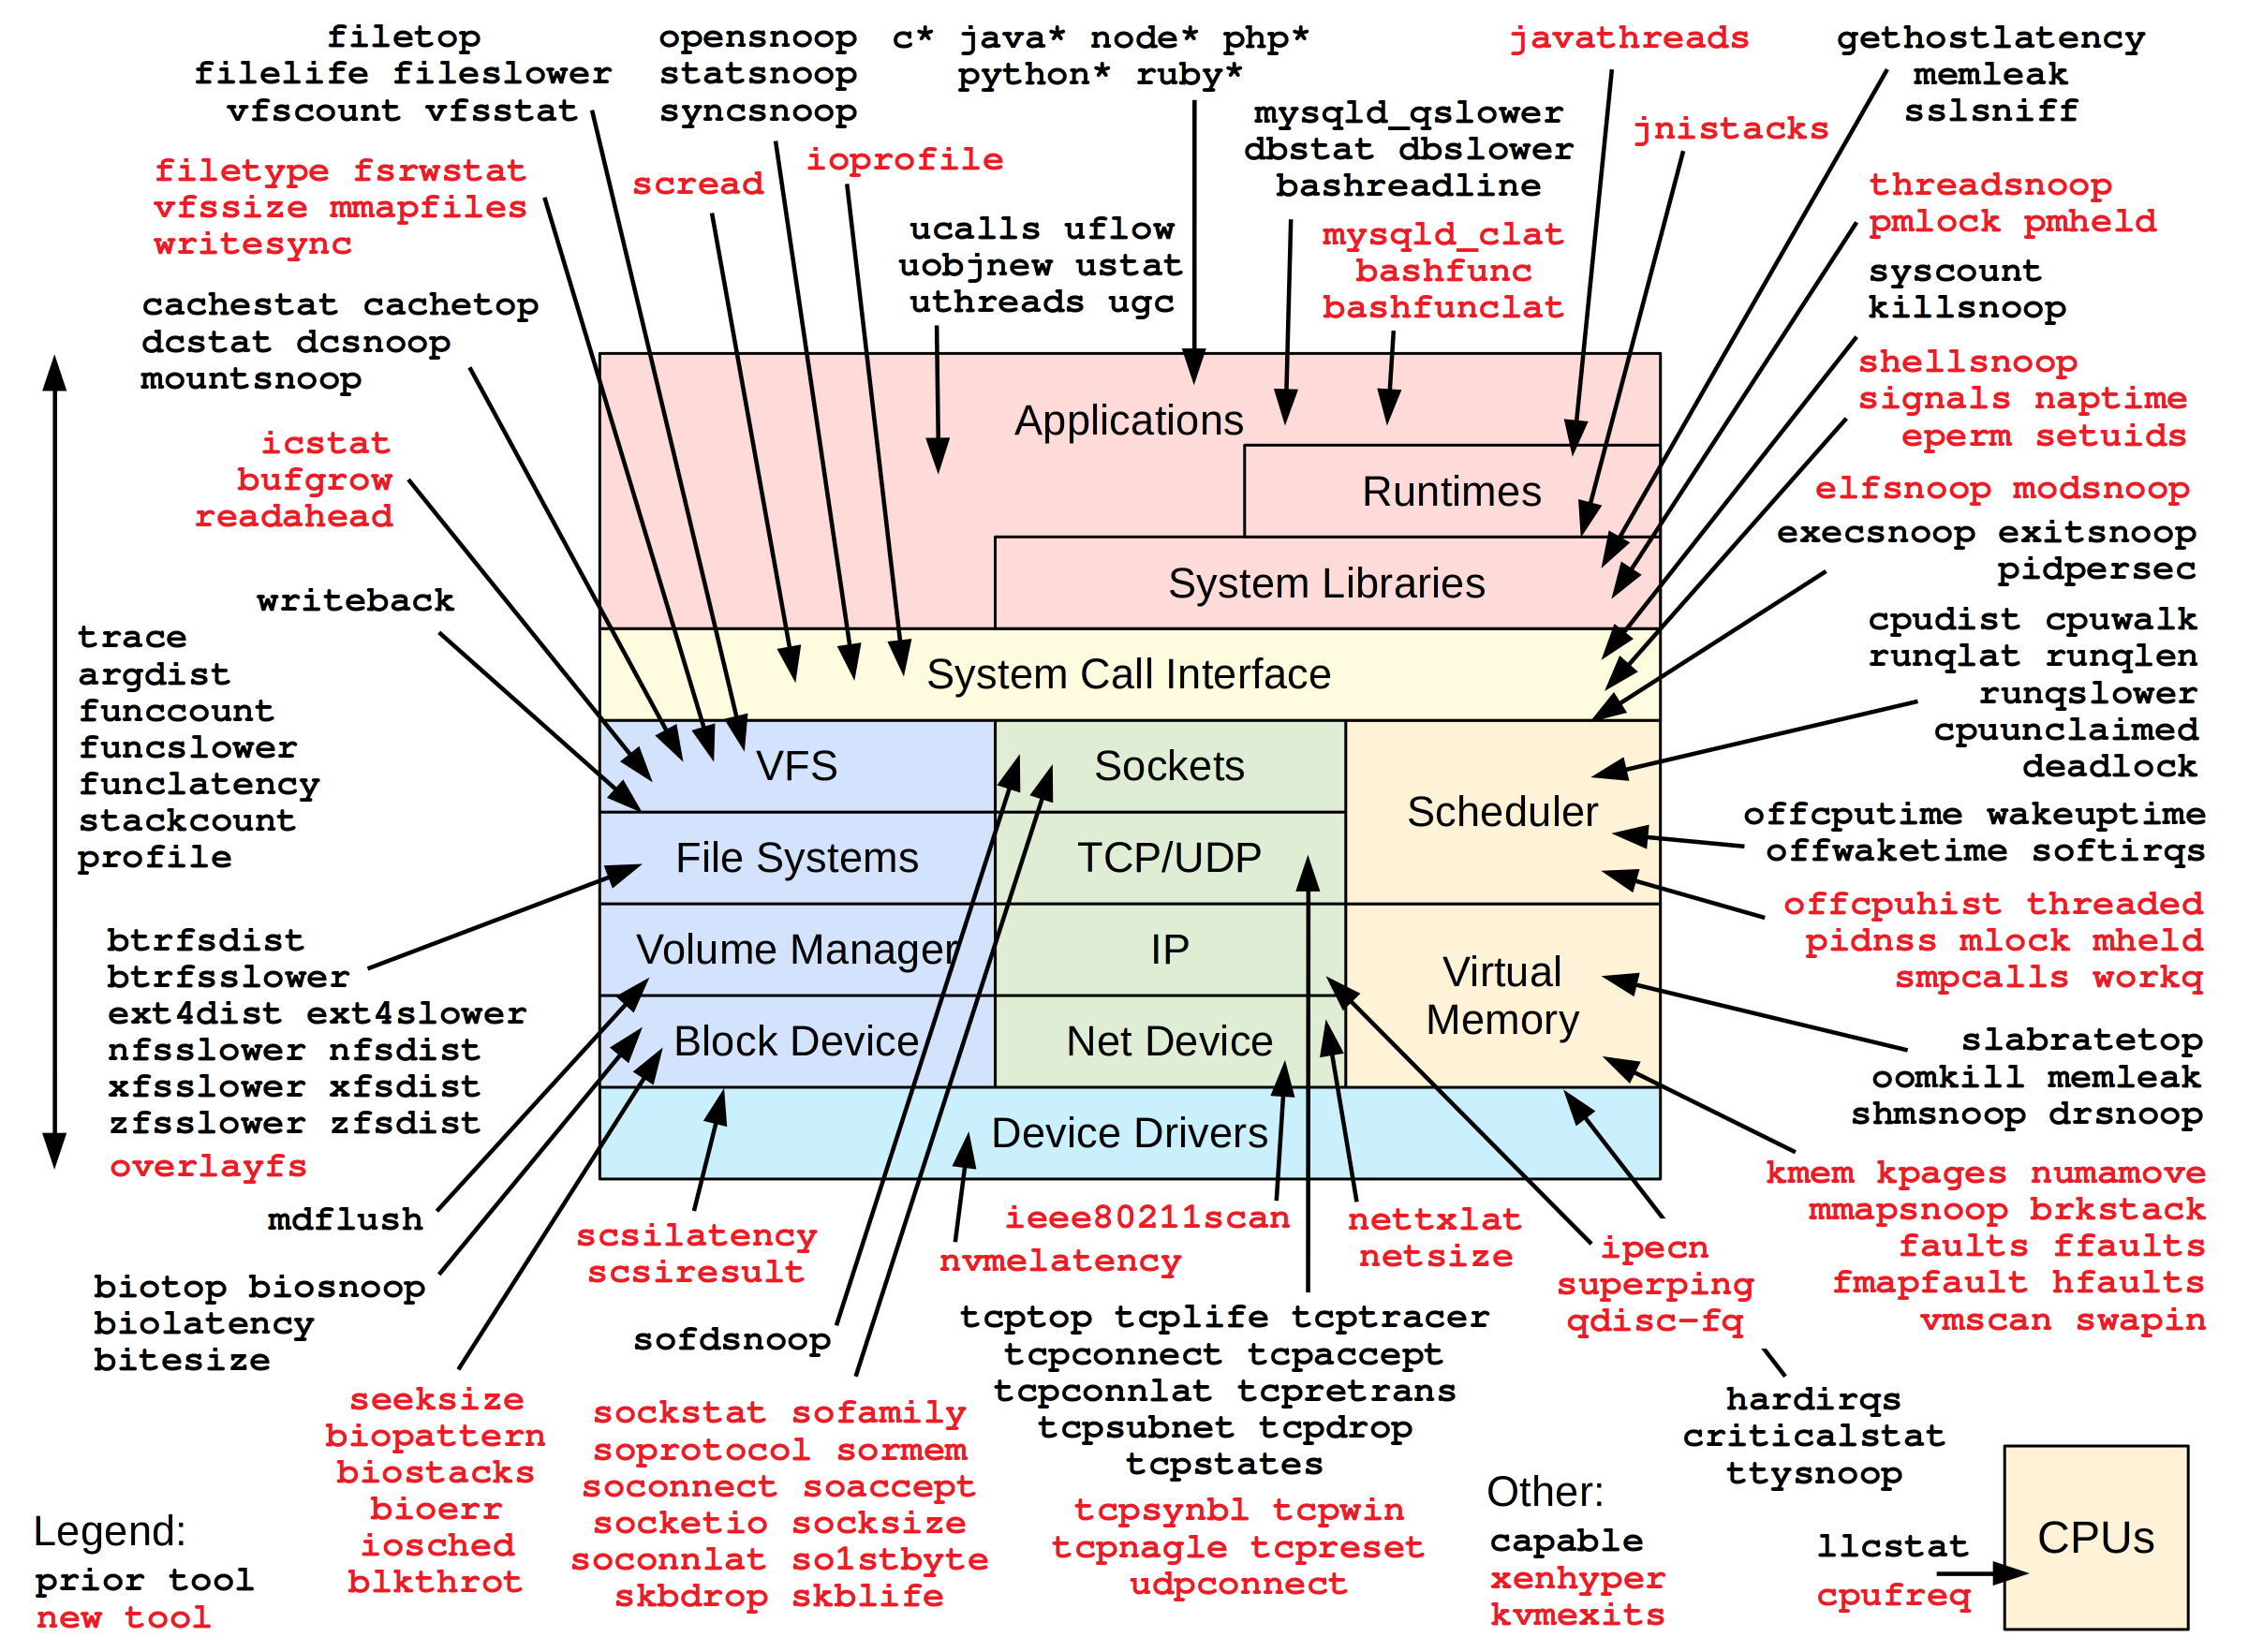
具体有哪些做好的工具可以使用呢?
可以看到下面的工具列表, 几乎涉及到linux方方面面的工具都有:
BCC的工具如下所示:
bpftrace工具列表:
大神brendangregg也开发了很多工具, 列表如下
如何安装
ubuntu下:
sudo apt update && sudo apt install -y bpfcc-tools linux-headers-$(uname -r)
BPF能解决什么问题呢?
几个例子了解下BPF的使用
1. 追踪全系统中正在打开的文件
注: 例子用bpftrace实现的
bpftrace -e 'tracepoint:syscalls:sys_enter_openat { printf("PID %d: %s is opening: %s\n", pid, comm, str(args->filename)); }'

#输出内容
PID 573324: libuv-worker is opening: /home/song/.vscode-server/data/User/workspaceStorage/e2031a5a82
PID 574946: sed is opening: /etc/ld.so.cache
PID 574946: sed is opening: /usr/lib/x86_64-linux-gnu/libacl.so.1
PID 574946: sed is opening: /lib/x86_64-linux-gnu/libselinux.so.1
PID 574946: sed is opening: /lib/x86_64-linux-gnu/libc.so.6
PID 574946: sed is opening: /usr/lib/x86_64-linux-gnu/libpcre2-8.so.0
PID 574946: sed is opening: /lib/x86_64-linux-gnu/libdl.so.2
PID 574946: sed is opening: /lib/x86_64-linux-gnu/libpthread.so.0
PID 574946: sed is opening: /proc/filesystems
PID 574946: sed is opening: /usr/lib/locale/locale-archive
PID 574946: sed is opening: /usr/lib/x86_64-linux-gnu/gconv/gconv-modules.cache
PID 574946: sed is opening: /proc/stat
PID 574947: cat is opening: /etc/ld.so.cache
[...持续刷新]-e: 表示直接执行
tracepoint:syscalls:sys_enter_openat 一个静态探测点,指定了我们要在哪个静态观测点挂载程序. 这里表示 任何进程进入 openat 系统调用时
{...} 表示执行的命令是什么
printf 是打印命令
pid comm str(args-filename) 这些参数, 从哪里来的?
#查询方法
bpftrace -lv 'tracepoint:syscalls:sys_enter_openat'

tracepoint:syscalls:sys_enter_openat
    int __syscall_nr;
    int dfd;
    const char * filename;
    int flags;
    umode_t mode;
2. 看看bpf支持哪些能力
可以看到, 内核中所有以vfs_开头的函数都打出来了. 即,原本内核是很难观测到的, 尤其是内核函数的执行流程, 目前如果后续我想看内核中这些函数的调用逻辑, 可以使用bpftrace来进行追踪观察了
root@song-com:/home/song/src/learning/linux-kernel-code# bpftrace -l 'kprobe:vfs_*'
kprobe:vfs_fadvise
kprobe:vfs_fallocate
kprobe:vfs_truncate
kprobe:vfs_fchmod
kprobe:vfs_fchown
kprobe:vfs_open
kprobe:vfs_setpos
kprobe:vfs_llseek
kprobe:vfs_readf
kprobe:vfs_writef
kprobe:vfs_dedupe_file_range_one
kprobe:vfs_dedupe_file_range
kprobe:vfs_clone_file_range
kprobe:vfs_dedupe_get_page.isra.0
kprobe:vfs_write
kprobe:vfs_iter_read
kprobe:vfs_iter_write
kprobe:vfs_writev
kprobe:vfs_copy_file_range
kprobe:vfs_read
kprobe:vfs_readv
kprobe:vfs_get_tree
kprobe:vfs_get_super
kprobe:vfs_getattr_nosec
kprobe:vfs_getattr
kprobe:vfs_statx_fd
kprobe:vfs_statx
kprobe:vfs_get_link
kprobe:vfs_rmdir
kprobe:vfs_unlink
kprobe:vfs_tmpfile
kprobe:vfs_rename
kprobe:vfs_whiteout
kprobe:vfs_mknod
kprobe:vfs_create
kprobe:vfs_symlink
kprobe:vfs_mkobj
kprobe:vfs_mkdir
kprobe:vfs_link
kprobe:vfs_path_lookup
kprobe:vfs_readlink
kprobe:vfs_ioctl
kprobe:vfs_ioc_fssetxattr_check
kprobe:vfs_ioc_setflags_prepare
kprobe:vfs_create_mount
kprobe:vfs_kern_mount.part.0
kprobe:vfs_kern_mount
kprobe:vfs_submount
kprobe:vfs_getxattr_alloc
[...]
3. 系统IO很高,想知道是哪个进程、在对哪个文件进行频繁的写操作。
# 统计所有vfs_write的调用次数,按进程名和文件名聚合
bpftrace -e 'tracepoint:syscalls:sys_enter_write { @counts[comm, str(args->filename)] = count(); }'

#ERR!! 发现报错了
bpftrace -e 'tracepoint:syscalls:sys_enter_write { @counts[comm, str(args->filename)] = count(); }'
stdin:1:53-71: ERROR: Struct/union of type 'struct _tracepoint_syscalls_sys_enter_write' does not contain a field named 'filename'
tracepoint:syscalls:sys_enter_write { @counts[comm, str(args->filename)] = count(); }
上面是AI帮忙写的命令, 发现了错误. 大致意思是没有filename这个参数 针对命令错误的问题, 我们可以考虑采用前面的方法查询下sys_enter_write的接口
root@song-com:/usr/share# bpftrace -lv 'tracepoint:syscalls:sys_enter_write'
tracepoint:syscalls:sys_enter_write
    int __syscall_nr;
    unsigned int fd;
    const char * buf;
    size_t count;
可以看到只支持fd, 所以需要修改命令, 下面的命令就可以得到写入的进程以及写入的数据量了
bpftrace -e 'tracepoint:syscalls:sys_enter_write {     @write_counts[comm] = count();     @write_bytes[comm] = sum(args->count); }'

#结果

@write_bytes[sudo]: 1
@write_bytes[avahi-daemon]: 4
@write_bytes[rtkit-daemon]: 8
@write_bytes[which]: 16
@write_bytes[Lingma]: 22
@write_bytes[containerd]: 24
@write_bytes[gmain]: 24
@write_bytes[dockerd]: 32
@write_bytes[cpuUsage.sh]: 52
@write_bytes[tokio-runtime-w]: 92
@write_bytes[sed]: 265
@write_bytes[libuv-worker]: 496
@write_bytes[sshd]: 1081
@write_bytes[cat]: 5241
@write_bytes[node]: 79063
@write_bytes[ps]: 210624
@write_bytes[grep]: 237563
@write_bytes[ls]: 581682
@write_bytes[opensnoop-bpfcc]: 62005212

@write_counts[sudo]: 1
@write_counts[rtkit-daemon]: 1
@write_counts[which]: 2
@write_counts[gmain]: 3
@write_counts[containerd]: 3
@write_counts[dockerd]: 4
@write_counts[avahi-daemon]: 4
@write_counts[sed]: 5
@write_counts[tokio-runtime-w]: 9
@write_counts[Lingma]: 22
@write_counts[cat]: 23
@write_counts[sshd]: 24
@write_counts[cpuUsage.sh]: 26
@write_counts[ps]: 55
@write_counts[libuv-worker]: 62
@write_counts[grep]: 64
@write_counts[ls]: 176
@write_counts[node]: 9833
@write_counts[opensnoop-bpfcc]: 32244
4. 观察中断为什么不触发?
比如我写了一个驱动, 其中有中断处理函数my_irq_handler, 但是我想确认下为什么中断为什么没触发, 可以使用
# 打印my_irq_handler 中断处理函数的堆栈信息
bpftrace -e 'kprobe:my_irq_handler { printf("IRQ handler called!\\n"); kstack(); }'
5. 内存泄露问题排查
如何用bcc来定位内存泄露问题?
环境基于ubuntu20的版本下, 原本希望通过bcc工具集中的memleak进行排查, 但是发现无法下载到bcc, 但是有bcc的改进版本bpfcc
# 安装命令
sudo apt install -y bpfcc-tools linux-headers-$(uname -r)
安装后, 就会在/usr/sbin/目录下有许多的工具可以使用
可以使用memleak-bpfcc 工具来进行内存泄露的检测
例子
// 测试程序
#include <stdio.h>
#include <stdlib.h>
#include <unistd.h>

int main() {
    printf("开始内存泄漏测试程序...\n");
    printf("进程 PID: %d\n", getpid());

    sleep(20);

    // 故意制造内存泄漏
    for (int i = 0; i < 10; i++) {
        // 分配内存但不释放
        char *leaked_memory = malloc(1024);
        if (leaked_memory) {
            sprintf(leaked_memory, "泄漏的内存块 %d", i);
            printf("分配了 1024 字节内存块 %d\n", i);
        }
        sleep(2);  // 等待2秒
    }

    while (1) {
        printf("测试程序即将结束,留下了泄漏的内存...\n");
        sleep(5);
    }

    // sleep(10);  // 保持进程运行一段时间供memleak检测
    return 0;
}
memleak-bpfcc 程序使用
^Croot@song-com:/home/song/src/learning/bcc# memleak-bpfcc -p 620030
Attaching to pid 620030, Ctrl+C to quit.
[16:41:18] Top 10 stacks with outstanding allocations:
[16:41:23] Top 10 stacks with outstanding allocations:
[16:41:28] Top 10 stacks with outstanding allocations:
        3072 bytes in 3 allocations from stack
                main+0x4d [test_memleak]
                __libc_start_main+0xf3 [libc-2.31.so]
[16:41:33] Top 10 stacks with outstanding allocations:
        5120 bytes in 5 allocations from stack
                main+0x4d [test_memleak]
                __libc_start_main+0xf3 [libc-2.31.so]
[16:41:38] Top 10 stacks with outstanding allocations:
        8192 bytes in 8 allocations from stack
                main+0x4d [test_memleak]
                __libc_start_main+0xf3 [libc-2.31.so]
[16:41:43] Top 10 stacks with outstanding allocations:
        10240 bytes in 10 allocations from stack
                main+0x4d [test_memleak]
                __libc_start_main+0xf3 [libc-2.31.so]
可以看到, 泄露的位置已经显示出来了 main+0x4d [test_memleak]
下一步就是通过调试信息, 定位到具体的代码了
可以考虑使用addrline来定位
# 先获取下 main+0x4d 的具体地址
root@song-com:/home/song/src/learning/bcc# nm test_memleak | grep ' T main'
00000000000011e9 T main

# 计算0x地址
root@song-com:/home/song/src/learning/bcc# printf "0x%x\n" $((0x11e9 + 0x4d))
0x1236

#addr2line得到代码
root@song-com:/home/song/src/learning/bcc# addr2line -e test_memleak -fC 0x1236
main
/home/song/src/learning/bcc/test_memleak.c:14或者可以使用gdb也可以
root@song-com:/home/song/src/learning/bcc# gdb test_memleak
(gdb) l *(main+0x4d)
0x1236 is in main (test_memleak.c:14).
9           sleep(20);
10
11          // 故意制造内存泄漏
12          for (int i = 0; i < 10; i++) {
13              // 分配内存但不释放
14              char *leaked_memory = malloc(1024);
15              if (leaked_memory) {
16                  sprintf(leaked_memory, "泄漏的内存块 %d", i);
17                  printf("分配了 1024 字节内存块 %d\n", i);
18              }
(gdb)
6. CPU调度延迟是多少?
测量一个任务从进入“可运行”状态到真正获得CPU开始执行的调度延迟。
原始程序 两个线程: fusion_thread hog_thread fusion_thread线程是默认线程 hog_thread线程是干扰线程 两个线程绑定在一个核心上进行竞争
方法1:通过BCC预装的脚本来实现
runqslower-bpfcc 1000runqslower-bpfcc 脚本可以监控整个系统的进程的调度延迟
监控结果:
从下表可以看到 fusion_thread的延迟很大, 基本都是10ms左右了.
root@song-com:/home/song/src/learning/bcc/delay_test/scripts# runqslower-bpfcc 1000
Tracing run queue latency higher than 1000 us
TIME     COMM             PID           LAT(us)
10:41:27 b'fusion_thread' 786744          10034
10:41:28 b'node'          758682          10021
10:41:28 b'fusion_thread' 786744           9543
10:41:29 b'fusion_thread' 786744           9083
10:41:29 b'node'          758682           1651
10:41:29 b'fusion_thread' 786744           9236
10:41:29 b'kworker/0:0'   782791           8965
10:41:30 b'ksoftirqd/0'   9                4917
10:41:30 b'fusion_thread' 786744           8740
10:41:31 b'fusion_thread' 786744           9881
10:41:31 b'fusion_thread' 786744           9400
10:41:32 b'fusion_thread' 786744          10007
10:41:32 b'fusion_thread' 786744           9974
10:41:33 b'node'          786911           1259
10:41:33 b'fusion_thread' 786744           9103
10:41:33 b'node'          758644           1206
10:41:34 b'fusion_thread' 786744           9669
10:41:34 b'node'          758789          10191
10:41:34 b'node'          758789           2308
方法2:bpftrace脚本
/*
  bpftrace 脚本:统计从唤醒到真正上 CPU 的调度延迟
  - 仅跟踪 comm == "fusion_thread" 的线程(默认),可在脚本中修改 COMM
  - 阈值默认 1000us;可用外部脚本通过 sed 动态替换本文件中的 @threshold 值
*/

BEGIN
{
  @threshold = 1000;
  printf("sched latency: comm=fusion_thread thr=%d us\n", @threshold);
}

/* 记录唤醒时刻 */
tracepoint:sched:sched_wakeup
/args->comm == "fusion_thread"/
{
  @ts[args->pid] = nsecs;
}

/* 在被切入时计算延迟,并打印超阈值案例;同时维护直方图 */
tracepoint:sched:sched_switch
/args->next_comm == "fusion_thread"/
{
  $pid = args->next_pid;
  $ts = @ts[$pid];

  if ($ts)
  {
    $delta_ns = nsecs - $ts;
    $us = $delta_ns / 1000;

    @hist = hist($us);

    if (((uint64)$us) >= ((uint64)@threshold))
    {
      /* 打印上 CPU 时被谁让位 */
      printf("delay(us)=%d pid=%d prev=%s\n", $us, $pid, args->prev_comm);
    }

    delete(@ts[$pid]);
  }
}

END {
  print(@hist);
}
从这个代码上看, 逻辑不复杂
- tracepoint事件1: sched:sched_wakeup 调度唤醒 条件当前线程 args→comm == “fusion_thread”
- tracepoint事件2: sched:sched_switch 调度切换 条件被切入线程是fusion args→next_comm == “fusion_thread”
- delta_ns: 延迟时间, 即从我从ready⇒run之间的时间差 就是调度延迟
sched_wakeup:当线程被唤醒(准备运行)时。sched_switch:当线程被调度器选中并切换到 CPU 上运行时。
- hist: 延迟信息加入热力图
输出结果如下
可以看到调度直方图信息, 确认了延迟主要是调度延迟导致的
然后从日志的delay(us)=8761 pid=777549 prev=hog_thread 信息中可以看到前一个线程是hog_thread
那问题的下一步就是去找到hog_thread延迟的原因.
可以考虑的办法: 根据业务容忍度,调整融合线程优先级、绑核策略或削减高优先抢占窗口
root@song-com:/home/song/src/learning/bcc/delay_test/scripts# ./trace_bpftrace.sh 1000
sudo bpftrace /tmp/tmp.KPY2jeUDkX
Attaching 4 probes...
sched latency: comm=fusion_thread thr=1000 us
delay(us)=8761 pid=777549 prev=hog_thread
delay(us)=9713 pid=777549 prev=hog_thread
delay(us)=9567 pid=777549 prev=hog_thread
delay(us)=8344 pid=777549 prev=hog_thread
delay(us)=8899 pid=777549 prev=hog_thread
delay(us)=9606 pid=777549 prev=hog_thread
delay(us)=9559 pid=777549 prev=hog_thread
delay(us)=8629 pid=777549 prev=hog_thread
delay(us)=9823 pid=777549 prev=hog_thread
delay(us)=9689 pid=777549 prev=hog_thread
delay(us)=9873 pid=777549 prev=hog_thread
delay(us)=9841 pid=777549 prev=hog_thread
delay(us)=9476 pid=777549 prev=hog_thread
delay(us)=9854 pid=777549 prev=hog_thread
delay(us)=9271 pid=777549 prev=hog_thread
delay(us)=9332 pid=777549 prev=hog_thread
delay(us)=9969 pid=777549 prev=hog_thread
delay(us)=9157 pid=777549 prev=hog_thread
delay(us)=9342 pid=777549 prev=hog_thread
delay(us)=9234 pid=777549 prev=hog_thread
delay(us)=10018 pid=777549 prev=hog_thread
delay(us)=10029 pid=777549 prev=hog_thread
delay(us)=9567 pid=777549 prev=hog_thread
delay(us)=9282 pid=777549 prev=hog_thread
^C@hist:
[2, 4)                10 |@                                                   |
[4, 8)                58 |@@@@@@                                              |
[8, 16)              498 |@@@@@@@@@@@@@@@@@@@@@@@@@@@@@@@@@@@@@@@@@@@@@@@@@@@@|
[16, 32)             366 |@@@@@@@@@@@@@@@@@@@@@@@@@@@@@@@@@@@@@@              |
[32, 64)               4 |                                                    |
[64, 128)              0 |                                                    |
[128, 256)             0 |                                                    |
[256, 512)             0 |                                                    |
[512, 1K)              0 |                                                    |
[1K, 2K)               0 |                                                    |
[2K, 4K)               0 |                                                    |
[4K, 8K)               0 |                                                    |
[8K, 16K)             24 |@@                                                  |

@threshold: 1000
优化方法-分开绑核后
可以看到调度没有再出现尖峰
Attaching 4 probes...
sched latency: comm=fusion_thread thr=1000 us
^C@hist:
[2, 4)                27 |@@                                                  |
[4, 8)                82 |@@@@@@@@                                            |
[8, 16)              529 |@@@@@@@@@@@@@@@@@@@@@@@@@@@@@@@@@@@@@@@@@@@@@@@@@@@@|
[16, 32)             132 |@@@@@@@@@@@@                                        |
[32, 64)               3 |                                                    |


@hist:
[2, 4)                27 |@@                                                  |
[4, 8)                82 |@@@@@@@@                                            |
[8, 16)              529 |@@@@@@@@@@@@@@@@@@@@@@@@@@@@@@@@@@@@@@@@@@@@@@@@@@@@|
[16, 32)             132 |@@@@@@@@@@@@                                        |
[32, 64)               3 |                                                    |

@threshold: 1000
7. on-cpu火焰图和off-cpu火焰图分析
原始场景
- on-cpu线程 短睡眠 + 长 busy 循环,制造高 CPU 占用
- off-cpu线程 : 消费者100ms的超长持锁时间,导致了生产者在80ms时醒来后,不得不因等待锁而被阻塞20ms。
- consumer thread: 消费者线程持有锁一直在处理数据, 处理时间100ms
- producer thread: 生产好了后, 再去抢锁, 生产事件80ms
| 时间点 (大致) | 消费者 (Consumer) 状态 | 生产者 (Producer) 状态 | 锁 (g_mutex) 状态 |
|---|---|---|---|
| 0ms - 80ms | ON-CPU (持锁忙等) | OFF-CPU (休眠) | 被 Consumer 持有 |
| 80ms - 100ms | ON-CPU (持锁忙等) | OFF-CPU (等待锁) | 被 Consumer 持有 |
| 100ms - 101ms | OFF-CPU (等待条件变量) | ON-CPU (持锁运行) | 被 Producer 持有 |
| 101ms - … | ON-CPU (被唤醒,处理) | OFF-CPU (休眠) | 先被 Consumer 持有,后释放 |
目标 目前需要定位的on-cpu线程为什么耗时长? 生产者线程为什么也耗时长?
采用bcc现有工具
profile-bpfcc 和 offcputime-bpfcc
# on-cpu脚本中选取
profile-bpfcc -F 99 -L "$TID" -f "$DUR" > "$TMP"
# off-cpu脚本中选取
offcputime-bpfcc -f -p "$TID" "$DUR" > "$TMP"
on_cpu结果如下:
on-cpu 会生成折叠栈
oncpu;start_thread;oncpu_fn;busy_spin_us.constprop.0 21
oncpu;start_thread;oncpu_fn;busy_spin_us.constprop.0 26
oncpu;start_thread;oncpu_fn;busy_spin_us.constprop.0 27
oncpu;start_thread;oncpu_fn;busy_spin_us.constprop.0 29
oncpu;start_thread;oncpu_fn;busy_spin_us.constprop.0 30
oncpu;start_thread;oncpu_fn;busy_spin_us.constprop.0 33
oncpu;start_thread;oncpu_fn;busy_spin_us.constprop.0 37
oncpu;start_thread;oncpu_fn;busy_spin_us.constprop.0 37
oncpu;start_thread;oncpu_fn;busy_spin_us.constprop.0 42
oncpu;start_thread;oncpu_fn;busy_spin_us.constprop.0 219
oncpu;start_thread;oncpu_fn;busy_spin_us.constprop.0 425
oncpu;start_thread;oncpu_fn;busy_spin_us.constprop.0 555
对应的火焰图如下:
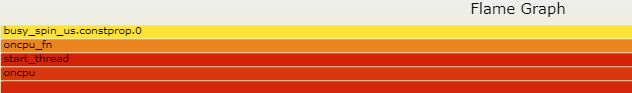
可以看到消耗都在busy_spin_us这个函数中, 这个函数在模拟自旋锁消耗cpu
off-cpu结果如下:
抓了生产者线程的off-cpu情况
可以看到大部分off-cpu是在clock_nanosleep中, 也就是sleep函数
然后小部分是在lock_wait函数中, 也就是锁等待函数
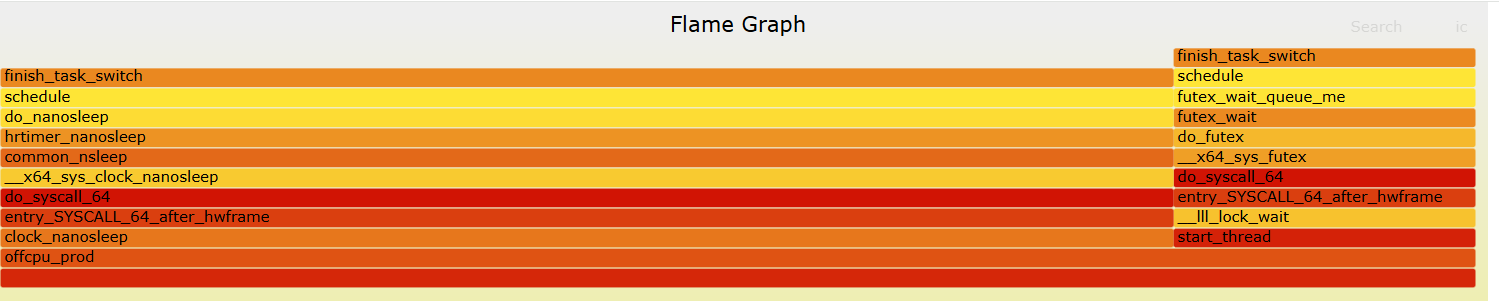 详细分析
详细分析
 再看统计结果中,睡眠时间占用79.5% 这个和源码设计中80ms睡眠, 20ms的锁等待基本一致
采用bpftrace来实现
on_cpu问题
/* oncpu.bt: 对特定 TID 的 on-CPU 栈进行定频采样
 * 参数:$1 = TID, $2 = 采样频率(Hz), $3 = 运行时长(秒)
 */

BEGIN {
  printf("oncpu.bt: pid=%d hz=%d dur=%d\n", $1, $2, $3);
}

profile:hz:$2 /pid == $1/ {       /*定时采样 以一个预设的固定频率hz触发*/
  @k[ kstack ] = count();   /* 记录内核栈*/
  @u[ ustack ] = count();   /* 记录用户栈 */
}

interval:s:$3 {              /*定时器 在一个预设的时间间隔s后触发一次*/
  printf("\n-- kernel stacks --\n");
  print(@k);
  printf("\n-- user stacks --\n");
  print(@u);
  clear(@k); clear(@u);
  exit();
}
输出的结果如下
oncpu.bt: pid=898650 hz=99 dur=10

-- kernel stacks --
@k[]: 487


-- user stacks --
@u[
    0x7ffe4b9ec8e4
    clock_gettime+37
]: 1
@u[
    busy_spin_us.constprop.0+109
    oncpu_fn+149
    start_thread+217
]: 6
@u[
    busy_spin_us.constprop.0+100
    oncpu_fn+149
    start_thread+217
]: 6
@u[
    busy_spin_us.constprop.0+112
    oncpu_fn+149
    start_thread+217
]: 7
@u[
    busy_spin_us.constprop.0+128
    oncpu_fn+149
    start_thread+217
]: 7
@u[
    busy_spin_us.constprop.0+120
    oncpu_fn+149
    start_thread+217
]: 8
@u[
    busy_spin_us.constprop.0+116
    oncpu_fn+149
    start_thread+217
]: 9
@u[
    busy_spin_us.constprop.0+142
    oncpu_fn+149
    start_thread+217
]: 10
@u[
    busy_spin_us.constprop.0+96
    oncpu_fn+149
    start_thread+217
]: 12
@u[
    busy_spin_us.constprop.0+124
    oncpu_fn+149
    start_thread+217
]: 17
@u[
    busy_spin_us.constprop.0+137
    oncpu_fn+149
    start_thread+217
]: 81
@u[
    busy_spin_us.constprop.0+105
    oncpu_fn+149
    start_thread+217
]: 137
@u[
    busy_spin_us.constprop.0+132
    oncpu_fn+149
    start_thread+217
]: 186
可以看到: busy_spin_us数量最多, 这个和用户层代码是一致的.
/* offcpu.bt: 统计特定 TID 的 off-CPU 等待时间(us)直方图,并打印用户/内核栈
 * 由外部脚本用 sed 注入:__PID__ __DUR__
 */

BEGIN { printf("offcpu.bt: pid=%d dur=%d\n", __PID__, __DUR__); }

tracepoint:sched:sched_switch /args->prev_pid == __PID__/ {
  @ts = nsecs;
  @uk = kstack;
  @uu = ustack;
}

tracepoint:sched:sched_switch /args->next_pid == __PID__/ {
  $t = @ts;
  if ($t) {
    $us = (nsecs - $t) / 1000;
    @off = hist($us);
    @k[@uk] = count();
    @u[@uu] = count();
    delete(@ts); delete(@uk); delete(@uu);
  }
}

interval:s:__DUR__ {
  printf("\n-- offcpu(us) hist --\n");
  print(@off);
  printf("\n-- kernel stacks --\n");
  print(@k);
  printf("\n-- user stacks --\n");
  print(@u);
  exit();
}注意: 会遇到没有符号的情况, 或者栈无法正常回溯情况 可以考虑添加编译选项
-fno-omit-frame-pointer-fno-optimize-sibling-calls,确保用户栈可回溯
BPF具体使用方法汇总
BCC 有哪些好用的工具?
bpftrace 有哪些好用的工具?
bpftrace 作为类shell语法, 语法规则是什么?
bpftrace语言相对简单, 可以学习这个教程方便后面快速的去观察内核的行为, 可以参考下面的文档